As usual, there are plenty of new ideas and ongoing experimentations around STINGER. We are releasing a new stable release of STINGER - r584. It features:
- Bug fixes,
- LLVM target
- Jason Riedy's community reagglomeration code
- New implementation of saving and loading STINGER
- Secondary faster R-MAT graph generator
- Java + Python docs through Doxygen.
Update December 1, 2013:
The information below is still mostly accurate and relevant for a historical understanding of the Next Gen STINGER; however, most of the features below have been rolled into Next Gen STINGER (see this post) which is available on the downlod page and on GitHub here.
Recently there has been a big design and development push to integrate all of the many algorithms and features that have been created on top of STINGER into a single analysis package. Mostly this effort has been moved into an experimental branch within the public subversion repository called "rad". This branch centers around the concept of a workflow which integrates and manages one or more data input streams, a single STINGER graph, and one or more dynamic and streaming graph algorithms. The workflow handles the routing of data and the configuration of each stream and algorithm through a common interface. Algorithms can commit results to a shared space and read the results of other algorithms to make it easier to combine approaches and achieve more interesting results (for example, you write an algorithm that combines community detection results with approximate betweenness centrality results to track the vertex with the highest approximate centrality within each community).
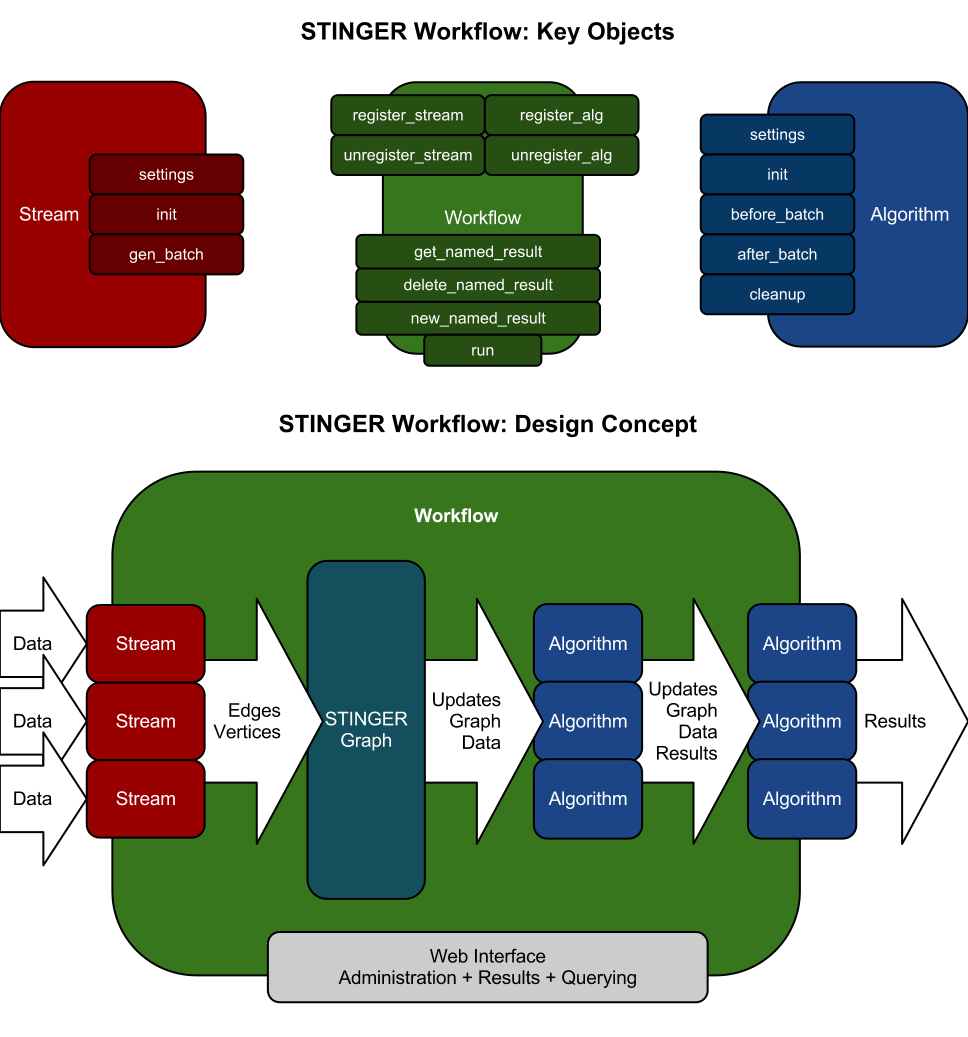
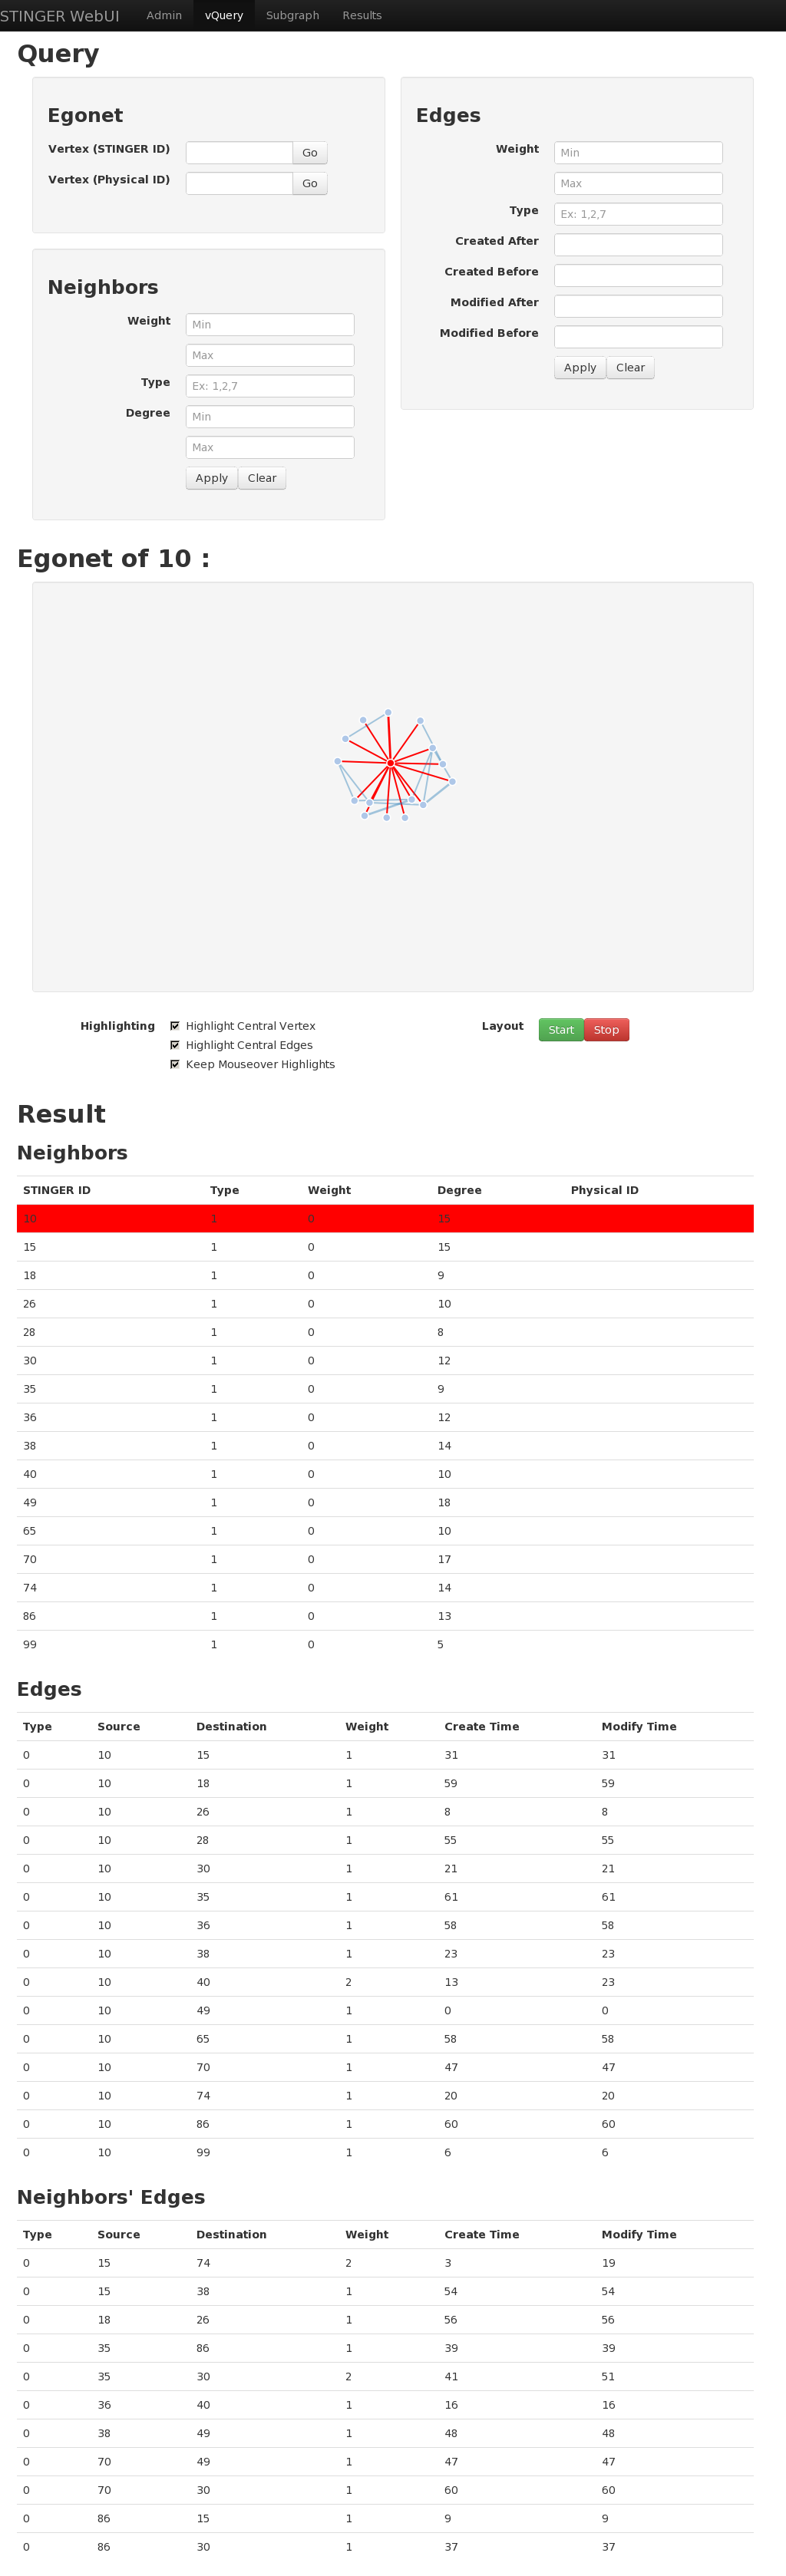
The workflow will allow you to add, remove and reconfigure streams and algorithms from the library we have built up as needed. You can also write your own and easily register them with the workflow. In the future, registering new algorithms and streams will be possible through a plug-in interface at runtime. To manage the execution and monitor the status of the workflow, we are developing a web interface. This interface will also let you query and explore the egonets around the vertices in the graph while providing a visual and tabular representation (courtesy of Mongoose, d3.js, and Bootstrap). The egonet data is also available in JSON format over HTTP. In the future, the interface will also allow users to extract interesting subgraphs reported by the persistent analytics for further more detailed study. You might imagine extracting a community of hundreds or thousands of users from a graph of billions in order to explore the data in detail by hand in a Python package. Lastly, this interface will provide graphical results that can be downloaded for aditional statistical analysis and reporting.
A prototype of this interface is running now and is available periodically from http://hpc13.cc.gt.atl.ga.us:8088/vquery for testing (picture below). The STINGER graph running the graph is dynamic, so if the vertex does not appear, it may have been deleted. Refresh the page and it will likely have been re-added. You can download and build rad through the public subversion here: http://svn.cc.gatech.edu/graphs/stinger/branches/rad, but please be aware that it is highly experimental. Eventually rad features will likely be moved into the trunk as they stabilize.